Easily Insert Excel Linked Charts or Graphs onto PowerPoint Slides
by Avantix Learning Team | Updated May 16, 2022
Applies to: Microsoft® PowerPoint® 2013, 2016, 2019, 2021 and 365, (Windows)
It's easy to insert a linked Excel chart or graph into PowerPoint by copying and pasting. There are two common methods you can use – copy and paste to insert a linked chart or copy and paste special to insert an embedded chart with a link. If you insert a linked or embedded Excel chart, you can update the chart in PowerPoint when the Excel source file changes.
If you created a linked chart in PowerPoint by copying and pasting a chart from Excel, the chart displays in PowerPoint and you can format it, refresh it and even animate the chart elements. A linked chart can be updated by refreshing the data. If you embed an Excel chart using Paste Special and then Paste link, you will need to format the chart in Excel as it is displayed as an embedded object in PowerPoint. You can double-click an embedded chart object to open the Excel file and then edit the file.
Linked and embedded charts with a link are stored in the source Excel file. The PowerPoint presentation (destination file) stores the location of the source file.
If you add a lot embedded Excel charts with a link in a PowerPoint deck, it will increase the size of the PowerPoint file so you may want to break the links when the presentation is finalized if you need to reduce the size of your PowerPoint file. It's best to break links in a copy of the presentation.
Recommended article: How to Break, Update or Change Links to Excel Charts or Worksheets in PowerPoint
Do you want to learn more about PowerPoint? Check out our virtual classroom or in-person classroom PowerPoint courses >
Insert a linked Excel chart into PowerPoint using Copy and Paste
To insert a linked Excel chart or graph onto a PowerPoint slide by copying and pasting:
- Open the Excel workbook containing the chart you want to use.
- Save the workbook.
- Click in a blank area in the chart or on the edge of the chart.
- Press Ctrl + C. Alternatively, right-click and select Copy. You can also press Shift + F10 or press the Context button on your keyboard to display the context menu and then select Copy.
- Open the PowerPoint presentation in which you want to insert the chart.
- Go to Normal View (click the Normal button on the bottom right) and display the slide where you want to insert the chart.
- Click the Home tab in the Ribbon and in the Slides group, select the Title Only layout from the Layout drop-down menu. You can also delete the body placeholder on the slide by clicking its edge and then pressing Delete.
- Click in a blank area on the slide.
- Press Ctrl + V to paste the chart onto the slide. A Smart Tag appears on the bottom right of the chart.
- Click the Smart Tag. A drop-down menu appears.
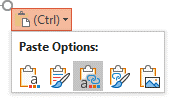
- Select one of the options (hover over the icons to view a pop-up about each option). You can select Use Destination Theme and Embed Workbook, Keep Source Formatting & Embed Workbook, Keep Source Formatting & Link Data, Use Destination Theme & Link Data or Picture. You can also press Shift + F10 or the Context button on your keyboard to display the context menu and then select the desired option. The two Link options will create links to the original Excel file and can be managed and updated.
- If necessary, resize the chart by dragging the corner handles and move the chart by dragging it by its edge.
If you want the chart to keep the formatting from the Excel file, select Keep Source Formatting & Link Data. If you want the chart to use the formatting in the PowerPoint presentation, select Use Destination Theme & Link Data.
The following options appear when you click the Smart Tag:
If you use the same theme colors in both the Excel file and the PowerPoint deck, you should achieve more consistent chart formatting. If the chart does not format in PowerPoint using the destination theme method, the chart may have been formatted in Excel using standard colors (which override theme colors) and non-theme fonts.
Update or refresh a linked chart
If you use the copy and paste method to insert a linked chart, you will be able to refresh it using the chart tools in PowerPoint.
To update or refresh a linked chart:
- In Normal View, click the chart on the slide.
- Click the Chart Design or Chart Tools Design tab in the Ribbon.
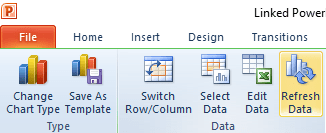
- Click Refresh Data in the Data group.
Refresh data appears in the Ribbon in PowerPoint when you click a linked chart:
Insert an embedded Excel chart with a link into PowerPoint using Paste Special
To insert an embedded Excel chart or graph with a link onto a PowerPoint slide using Paste Special:
- Open the Excel workbook containing the chart you want to use.
- Save the workbook.
- Click in a blank area in the chart.
- Click the Home tab in the Ribbon and click Copy in the Clipboard group.
- Go to Normal View (click the Normal button on the bottom right) and display the slide where you want to insert the chart.
- Click the Home tab in the Ribbon and in the Slides group, select the Title Only layout from the Layout drop-down menu. You can also delete the body placeholder on the slide by clicking its edge and then pressing Delete.
- Click in a blank area on the slide.
- Click the Home tab in the Ribbon and click Paste in the Clipboard group. A drop-down menu appears.
- Select Paste Special. A dialog box appears.
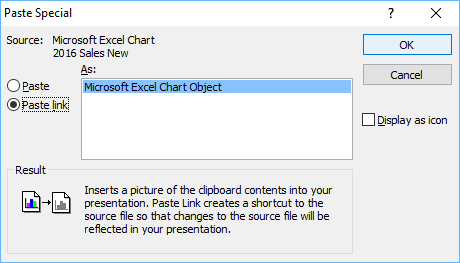
- Click Paste link and then select Microsoft Excel Chart Object. If you click Paste, not Paste link, the embedded object will not be linked to the source Excel file.
- Click on OK.
- If necessary, resize the chart by dragging the corner handles and move the chart by dragging it by its edge.
Below is the Paste Special dialog box in PowerPoint:
Excel will insert an embedded chart that is linked to the original chart. You will not be able to format the embedded chart object in PowerPoint.
Refresh or update embedded Excel charts
To update an embedded chart with a link in PowerPoint if the Excel data has changed:
- Save the PowerPoint file.
- Click the File tab in the Ribbon and then click Info.
- On the bottom right, click Edit Links. A dialog box appears.
- Click the link path you want to update and then click Update.
- Click OK.
If both the Excel and PowerPoint files are open, embedded charts should automatically update.
Open presentations with embedded charts with links
If you have embedded charts with links in a PowerPoint presentation, each time you open the presentation, PowerPoint should prompt you to update the links or Enable Content.
Troubleshoot linked or embedded Excel charts
In order to insert a linked or embedded Excel chart with links and maintain the links, you should:
- Save the Excel workbook first before linking with PowerPoint
- Keep the Excel file in the same folder as the PowerPoint file if you can
- Ensure the Excel file is not moved to another folder or the link will break (you can fix this issue)
- Ensure the Excel file is not renamed or the link will break (you can fix this issue)
If the Excel file has been moved or renamed, you'll still be able to view the chart in PowerPoint but you won't be able to update or edit the chart unless you change the source using Edit Links.
You can double-click an embedded chart object to open the Excel source file and then edit the data in Excel. When you save the edited file and return to PowerPoint, the updated chart should appear automatically in your presentation.
Linked or embedded charts with links can present a security issue as users may be able to access the source Excel file and select other tabs in the workbook. If you email the presentation without the source Excel files, this is not an issue. You can also break links to embedded charts before sharing the PowerPoint presentation.
This article was first published on December 16, 2016 and has been updated for clarity and content.
Subscribe to get more articles like this one
Did you find this article helpful? If you would like to receive new articles, join our email list
More resources
3 Ways to Change the Font on All Slides in PowerPoint
How to Quickly Remove All Speaker Notes in PowerPoint (PC or Mac)
How to Insert Linked or Unlinked Excel Worksheet Data into PowerPoint
How to Reduce PowerPoint File Size (10 Ways to Compress PowerPoint Decks)
How to Break, Update or Change Links to Excel Charts or Worksheets in PowerPoint
Related courses
Microsoft PowerPoint: Intermediate / Advanced
Microsoft PowerPoint: Design for Non-Designers
Our instructor-led courses are delivered in virtual classroom format or at our downtown Toronto location at 18 King Street East, Suite 1400, Toronto, Ontario, Canada (some in-person classroom courses may also be delivered at an alternate downtown Toronto location). Contact us at info@avantixlearning.ca if you'd like to arrange custom instructor-led virtual classroom or onsite training on a date that's convenient for you.
Copyright 2024 Avantix® Learning
You may also like
How to Replace Zeros (0) with Blanks in Excel
There are several strategies to replace zero values (0) with blanks in Excel. If you want to replace zero values in cells with blanks, you can use the Replace command or write a formula to return blanks. However, if you simply want to display blanks instead of zeros, you have two formatting options – create a custom number format or a conditional format.
What is Power Query in Excel?
Power Query in Excel is a powerful data transformation tool that allows you to import data from many different sources and then extract, clean, and transform the data. You will then be able to load the data into Excel or Power BI and perform further data analysis. With Power Query (also known as Get & Transform), you can set up a query once and then refresh it when new data is added. Power Query can import and clean millions of rows of data.
How to Freeze Rows in Excel (One or Multiple Rows)
You can freeze one or more rows in an Excel worksheet using the Freeze Panes command. If you freeze rows containing headings, the headings will appear when you scroll down. You can freeze columns as well so when you scroll to the right columns will be frozen.
Microsoft, the Microsoft logo, Microsoft Office and related Microsoft applications and logos are registered trademarks of Microsoft Corporation in Canada, US and other countries. All other trademarks are the property of the registered owners.
Avantix Learning |18 King Street East, Suite 1400, Toronto, Ontario, Canada M5C 1C4 | Contact us at info@avantixlearning.ca


