Microsoft Excel: Data Analysis with Functions, Dashboards and What-If Analysis Tools
Microsoft Excel Training Series | Level 3
Course Details
Duration: 2 days (9 am – 4 pm)
Microsoft® Excel® Versions: 2016 | 2019 | 2021 | 2024 | 365 (Windows)
Delivery Methods (Instructor-led): In-person (Live classroom) | Online in virtual classroom
Course Dates: August 20/21, 2026 (Online in virtual classroom or In-person) | View schedule ![]()
Course Fee: $495 CAD per person + HST (Virtual classroom), $545 CAD per person + HST (Bring your own device for in-person courses) or $595 CAD per person + HST (Avantix Learning provides device for in-person courses)*
Timing: Public scheduled courses run from 9:00 am to 4:00 pm (Eastern Time).
Virtual classroom courses: Our instructor-led virtual classroom courses are delivered in a virtual classroom environment. Students will be sent a virtual classroom invitation prior to the course.
In-person classroom courses: Our instructor-led, live classroom (in-person) courses are held in downtown Toronto at 18 King Street East, Suite 1400, Toronto, Ontario, Canada. Some courses are also held at an alternate downtown Toronto location.
Custom training: This course may be delivered at your site or ours as an instructor-led virtual classroom or in-person solution. Contact us at info@avantixlearning.ca for more information including savings for custom group training.
Some public courses and / or formats and may be subject to a minimum enrollment requirement.
![]()
Course Overview
This Microsoft Excel course (formerly Microsoft Excel: Intermediate / Advanced Part 2) is designed for the user who wants to learn to use more advanced Excel features and functions including text functions, date functions, time functions, lookup functions, logical functions, information functions, trend functions, and forecast functions. While working on hands-on examples, students will also learn to use advanced pivot table techniques, create dashboards and use what-if analysis tools including Goal Seek, Scenario Manager, and one and two input Data Tables. During this hands-on course, students will practice their skills and have the opportunity to ask questions and interact with the instructor. Each student will also receive a full course manual with tips, tricks and shortcuts as well as sample and exercise files.
Prerequisite: Microsoft Excel: Intermediate / Advanced or equivalent knowledge and skills.
Next course(s) in this series: Microsoft Excel: Introduction to Power Query to Get and Transform Data, Microsoft Excel: Introduction to Power Pivot and Data Models, Microsoft Excel: Introduction to Dynamic Arrays or Microsoft Excel: Introduction to VBA (Visual Basic for Applications).
Related training: View all Microsoft Excel courses >
INCLUDED IN THIS COURSE
- Comprehensive course manual or published book
- Keyboard shortcuts quick reference
- Sample and exercise files
- Refreshments (for classes conducted in Avantix Learning classrooms)
- Certificate of completion
- Follow-up email support
Course Topics
Using VLOOKUP vs INDEX and MATCH vs XLOOKUP
- Combining INDEX and MATCH functions as an alternative to VLOOKUP
- Benefits of INDEX and MATCH
- Using the CHOOSE function vs VLOOKUP
- Using XLOOKUP (available in newer versions)
Using Logical Functions in Formulas and Conditional Formatting
- Using AND functions in formulas and conditional formatting
- Using OR functions in formulas and conditional formatting
Dealing with Errors
- Dealing with errors using the IFERROR or ISERROR functions
Finding Top Values and Ranking
- Calculating top values such as the 1st, 2nd and 3rd highest values
- Highlighting top values using conditional formatting
- Calculating rank in relation to a range of cells
Summarizing Data with SUMIFS, COUNTIFS and AVERAGEIFS
- Using multiple criteria with SUMIFS, COUNTIFS and AVERAGEIFS
- Referencing table fields
Creating Dependent or Cascading Drop-Down Lists
- Creating dependent or cascading drop-down lists that change depending on another value
Using Text Functions to Combine, Extract or Format Text
- Using text functions to manipulate text strings (8+ text functions)
- Extracting text strings from the left, middle or right of cells
- Finding and replacing text using functions
- Joining strings of text from two or more cells
- Separating data into multiple columns using text functions
- Changing case using text functions
- Removing extra characters from data
Using Date Functions to Convert, Extract or Format Dates
- Understanding how Excel interprets dates
- Entering valid dates in Excel
- Converting invalid dates into valid dates
- Using date functions to manipulate dates (10+ date functions)
- Extracting date increments from cells such as year, month and day
- Calculating the number of days or working days between two dates
- Calculating the date a specific number of working days from a date
- Finding the last day in the current month or a future month
- Creating calculations for fiscal months and quarters
- Using conditional formatting to highlight data within specific date periods
Working with Legacy Arrays vs Dynamic Arrays
- Advantages of legacy array formulas
- Recognizing traditional array formulas
- Creating and editing legacy array formulas
- Getting started with dynamic arrays
Using Trend and Forecast Functions
- TREND vs FORECAST functions
- Using the TREND function
- Using FORECAST vs FORECAST.LINEAR functions
Performing What-If Analysis
- Using Goal Seek to change cells to achieve a result
- Creating one and two-input data tables
- Adding and saving scenarios to test different possible outcomes such as best case and worst case
- Generating a summary of scenarios for comparison
- Tips when working with the Scenario Manager in Excel
- Using Solver (time permitting)
Creating Advanced Table Calculations
- Adding running totals in a table
- Calculating percent of total in a table
Using Advanced Pivot Table Techniques
- Creating and editing calculated fields in pivot tables
- Calculating percent totals in pivot tables
- Summarizing pivot table data by groups (number or date)
- Moving pivot tables and charts to other sheets
Combining Data from Multiple Worksheets
- Creating pivot tables from related data on different sheets using the Data Model
- Loading data from multiple worksheets into Power Query
- Combining or appending data from multiple sheets
- Loading combined data into Excel
- Creating a pivot table from the combined data
Creating and Formatting Dashboards
- Common components and functions used in dashboards
- Creating dashboards that include multiple pivot tables and pivot charts
- Setting dashboard components to consistent sizes
- Connecting slicers to multiple pivot tables and pivot charts
- Alternatives to pivot tables to create dashboards
- Tips for formatting dashboards
*Prices subject to change
Our instructor-led courses are delivered in virtual classroom format or at our downtown Toronto location at 18 King Street East, Suite 1400, Toronto, Ontario, Canada (some in-person classroom courses may also be delivered at an alternate downtown Toronto location). Contact us at info@avantixlearning.ca if you'd like to arrange custom instructor-led virtual classroom or onsite training on a date that's convenient for you.
Copyright 2025 Avantix® Learning
Custom training (Onsite or Online in Virtual Classroom)
Register now for a public course or contact us at info@avantixlearning.ca for more information about any of our courses or to discuss custom training options (virtual classroom or in-person in live classroom).
FIND THE BEST EXCEL COURSE FOR YOUR NEEDS >
Related courses
Microsoft Excel: Intermediate / Advanced
Microsoft Excel: Introduction to Power Query to Get and Transform Data
Microsoft Excel: Introduction to Power Pivot and Data Models
Microsoft Excel: Introduction to Dynamic Arrays and Next-Generation Excel Functions
Microsoft Excel: Data Visualization Techniques
Microsoft Excel: Visual Basic for Applications (VBA) Macros | Introduction
You may like

What is Power Query in Excel?
What is Power Query in Excel and Why is It So Useful? by Avantix Learning Team | Updated October 18, 2024 Applies to: Microsoft® Excel® 2016, 2019, 2021 and 365 (Windows) Power Query in Excel is a powerful data transformation tool that allows you to import data from...

How to Stop or Control Green Error Checking Markers in Excel
Turn Off or Customize Error Checking Options (and Markers) in Excel by Avantix Learning Team | Updated September 15, 2023 Applies to: Microsoft® Excel® 2010, 2013, 2016, 2019, 2021 and 365 (Windows) In Microsoft Excel, errors are flagged by default with a small green...
Excel Shortcuts to Zoom In and Out in Your Worksheets (4 Shortcuts)
Save Time in Microsoft Excel using Shortcuts to Zoom In or Out by Avantix Learning Team | Updated September 14, 2023 Applies to: Microsoft® Excel® 2013, 2016, 2019, 2021 and 365 (Windows) There are several mouse and keyboard shortcuts you can use to zoom in and out in...

How to Use Flash Fill in Excel (4 Ways with Shortcuts)
4 Ways to Use Flash Fill in Excel to Extract, Combine, Clean or Format Data by Avantix Learning Team | Updated February 26, 2026 Applies to: Microsoft® Excel® 2016, 2019, 2021, 2024 or 365 (Windows) You can use Flash Fill in Excel to extract, combine, clean or format...

How to Convert Text to Numbers in Excel (5 Ways)
5 Ways to Convert Numbers Stored as Text to Numbers in Excel by Avantix Learning Team | Updated December 20, 2024 Applies to: Microsoft® Excel® 2016, 2019, 2021 and 365 (Windows) There are several ways to convert text to numbers in Microsoft Excel. When data is...

How to Insert Multiple Rows in Excel (4 Fast Ways with Shortcuts)
Insert Multiple Rows Quickly in an Excel Worksheet by Avantix Learning Team | Updated September 15, 2023 Applies to: Microsoft® Excel® 2013, 2016, 2019, 2021 and 365 (Windows) You can quickly insert multiple rows in Excel using a drop-down menu, keyboard shortcuts or...

3 Excel Strikethrough Shortcuts to Cross Out Text or Values in Cells
Apply or Remove Strikethrough Using Shortcuts in Excel by Avantix Learning Team | Updated September 14, 2023 Applies to: Microsoft® Excel® 2013, 2016, 2019, 2021 and 365 (Windows) You can apply strikethrough to text or values in Excel to cross out or create a line...
How to Replace Blank Cells in Excel with Zeros (0), Dashes (-) or Other Values
Quickly Fill Blanks with Zeros or Other Values in Excel Worksheets (0, -, N/A, Null or Other Text) by Avantix Learning Team | Updated September 14, 2023 Applies to: Microsoft® Excel® 2010, 2013, 2016, 2019, 2021 and 365 (Windows) You can quickly replace blank cells in...

How to Convert Cm to Inches in Excel (or Inches to Cm)
Convert Inches to Centimeters or Vice Versa in Excel Worksheets by Avantix Learning Team | Updated October 14, 2022 Applies to: Microsoft® Excel® 2010, 2013, 2016, 2019, 2021 and 365 (Windows) You can convert cm to inches (inches to centimeters or centimetres) using...
You may also like
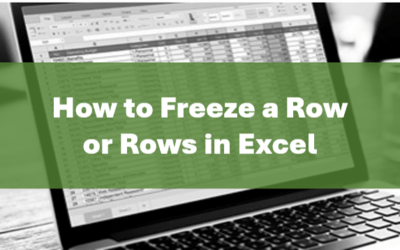
How to Freeze Rows in Excel (One or Multiple Rows)
You can freeze one or more rows in an Excel worksheet using the Freeze Panes command. If you freeze rows containing headings, the headings will appear when you scroll down. You can freeze columns as well so when you scroll to the right columns will be frozen.

How to Show or Hide Gridlines in Excel
You can remove or hide gridlines in Excel worksheets to simplify worksheet design. By default, gridlines are displayed but do not print. Gridlines are applied to entire worksheets or workbooks, not to specific cells. If you hide gridlines on one worksheet, it doesn't affect other sheets in the same workbook.

How to Insert Multiple Columns in Excel (4 Fast Ways with Shortcuts)
You can quickly insert multiple columns in Excel using a drop-down menu, keyboard shortcuts or the Home tab in the Ribbon. The key to inserting multiple columns at once, rather than one by one, is to select the number of columns you want to insert first and then insert columns. Excel will insert the same number of columns you selected.
Image credit(s) / application screenshot(s): Microsoft
Microsoft, the Microsoft logo, Microsoft Office and related Microsoft applications and logos are registered trademarks of Microsoft Corporation in Canada, US and other countries. All other trademarks are the property of the registered owners.
Avantix Learning |18 King Street East, Suite 1400, Toronto, Ontario, Canada M5C 1C4 | Contact us at info@avantixlearning.ca