

A Beginner's Guide to Using Visual Reports in Microsoft Project
Article by: Avantix Learning Team | Updated May 16, 2016
Applies to: Microsoft® Project® 2010, 2013 and 2016 (Standard and Professional)
Visual Reports offer a useful alternative for reporting compared to reports created within Microsoft Project. You can export data to both Excel and Visio using Visual Reports. These reports first appeared in Microsoft Project 2007 and are available in Project 2010, 2013 and 2016. In this article, we'll focus on getting started with Visual Reports and sending data to Excel using the templates that are shipped with Project.
The obvious benefit of Visual Reports is that data can be sent to Excel. Although many business users have Microsoft Excel installed, significantly fewer have a copy of Microsoft Project. As a result, sharing Project information can present a problem in many organizations. The Visual Reports button appears on the Project tab in the Ribbon in 2010 and in the Report tab in 2013 and 2016.
Below is the Project tab in 2010:

Below is the Report tab in 2013:

When a Visual Report is sent to Excel, both a PivotTable and PivotChart are created for the built-in templates. Once the report has been sent, you can customize it in Excel.
Recommended article: 10 Timesaving Shortcuts in Microsoft Project's Gantt Chart View
Do you want to learn more about Microsoft Project? Check out our virtual classroom or live classroom Project courses >
Access Visual Reports
To access Visual Reports:
- In Microsoft Project, click on the Report tab (2013 and 2016) or the Project tab (2010) on the Ribbon.
- Click on Visual Reports. A Create Report dialog box appears with the default Visual Report templates.
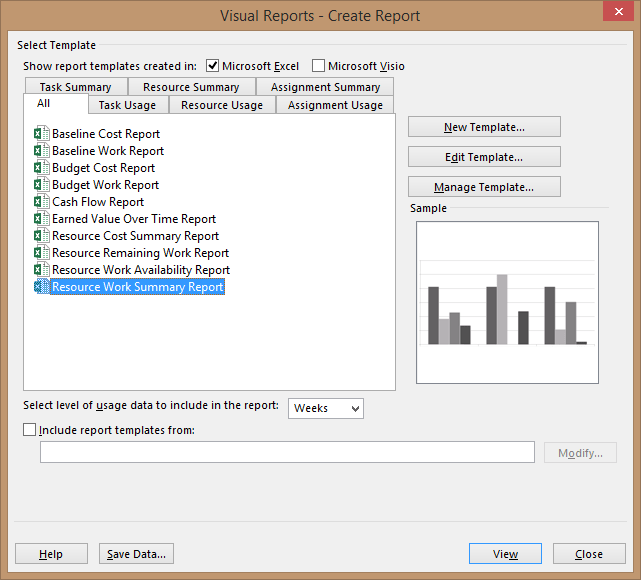
Use Visual Report templates
The default templates that are shipped with Project appear in the Create Report dialog box and are separated into categories. You can click on a category at the top or click on the All tab to view all report templates and then select the Excel button or checkbox at the top of the dialog box to view only Excel templates.
Excel Visual Report templates include:
- Cash Flow Report
- Earned Value Over Time Report
- Resource Cost Summary Report
- Resource Work Availability Report
- Resource Work Summary Report
- Resource Cost Summary Report
- Resource Work Availability Report
- Resource Work Summary Report
- Baseline Cost Report
- Baseline Work Report
- Budget Cost Report
- Budget Work Report
- Earned Value Over Time Report
- Resource Remaining Work Report
Create an Excel Visual Report using a template
To create an Excel Visual Report using a template:
- In Microsoft Project, click on the Report tab (2013 and 2016) or the Project tab (2010) on the Ribbon.
- Click on Visual Reports. A Create Report dialog box appears (usually with the default Visual Report templates).
- Ensure that the Excel checkbox at the top of the dialog box is selected.
- Click on the All tab and then click on the report you want to create.
- Select an option from the Select level of usage data drop-down menu. You can select Years, Quarters, Months, Weeks or Days. By default, Project sets the level of usage data to a recommended level for the project's size (which is usually weeks). If you change the level of usage to a more detailed level such as days, this may decrease the report performance and slow down the generating of the report.
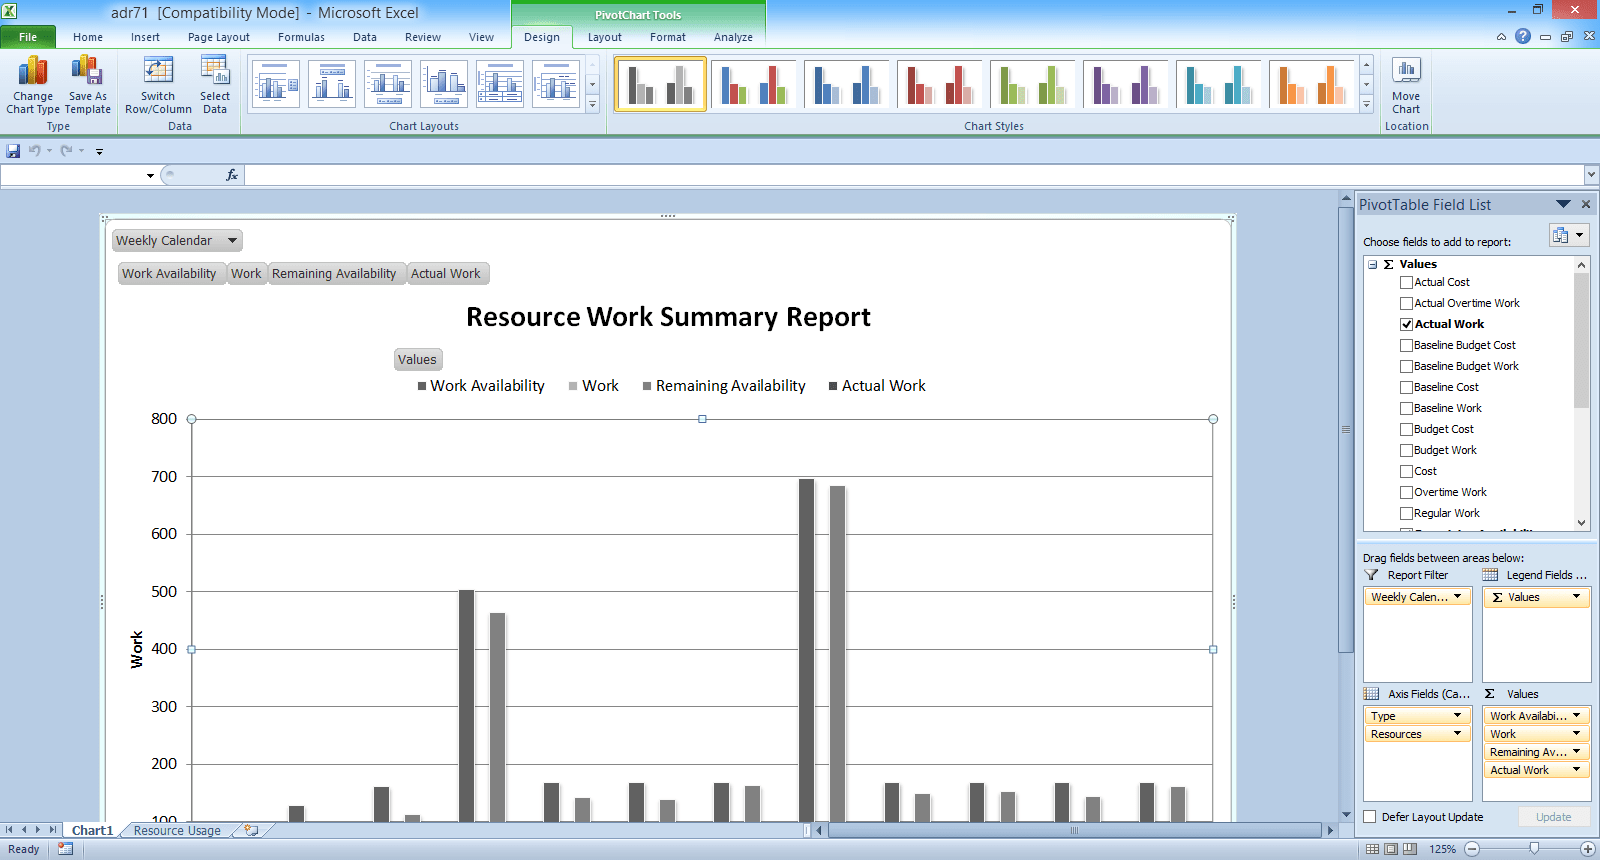
- Click on View to generate the report and open it in Excel. This may take a minute or two. The Excel report opens with tabs at the bottom of the workbook for a PivotChart and a PivotTable.
Below is the Resource Work Summary report in Excel 2010:
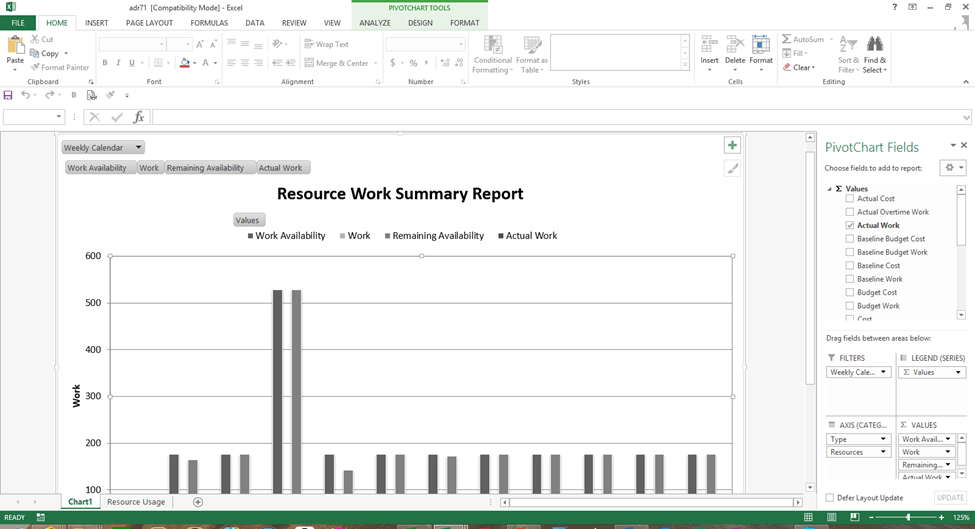
Below is the Resource Work Summary report in 2013:
Edit a Visual Report in Excel
Visual Reports sent to Excel appear in Compatibility Mode in 2010 and later versions and can therefore be read by older versions of Excel (the templates were originally created for 2007). You may want to save the report in the newest Excel format to take advantage of new features such as Sparklines. Eventually, you may even want to save your own templates in Excel.
To edit a PivotChart in a Visual Report in Excel:
- Click in the PivotChart in Excel that was created during the generation of the Visual Report.
- Click on the PivotChart Tools Design, Layout, Format or Analyze tabs (depending on your version of Excel) and choose the desired options to modify the PivotChart.
- Click in the PivotChart Field List and select any fields you wish to add to the PivotChart.
- You may want to click on the File tab on the Ribbon and select Save As, then select Microsoft Excel as the format (if you want to use new features), enter a name for the file and click on Save.
To edit a PivotTable in a Visual Report in Excel:
- Click in the PivotTable in Excel that was created during the generation of the Visual Report.
- Click on the PivotTable Tools Design, Options or Analyze tabs (depending on your version of Excel) and choose the desired options to modify the PivotTable.
- Click in the PivotTable Field List and select any fields you wish to add to the PivotTable.
- You may want to click on the File tab on the Ribbon and select Save As, then select Microsoft Excel as the format (if you want to use new features such as Sparklines), enter a name for the file and click on Save.
In this article, we used existing templates to create Visual Reports. You can also modify a Visual Report template and create a new Visual Report template.
Subscribe to get more articles like this one
Did you find this article helpful? If you would like to receive new articles, JOIN our email list.
More resources
How to Create a Timeline in MIcrosoft Project
Auto vs Manual Scheduling in Microsoft Project
Send Microsoft Project Data to Excel with Visual Reports
10 Microsoft Project Tips for Working Efficiently with Tables
10 Shortcuts to Zoom and Move Quickly in Microsoft Project's Gantt Chart Timescale
Related courses
Microsoft Project: Introduction
Microsoft Project: Intermediate / Advanced
Microsoft Project: Introduction to VBA (Visual Basic for Applications)
Our instructor-led courses are delivered in virtual classroom format or at our downtown Toronto location at 18 King Street East, Suite 1400, Toronto, Ontario, Canada (some in-person classroom courses may also be delivered at an alternate downtown Toronto location). Contact us at info@avantixlearning.ca if you'd like to arrange custom instructor-led virtual classroom or onsite training on a date that's convenient for you.
Copyright 2024 Avantix® Learning
You may also like
How to Replace Zeros (0) with Blanks in Excel
Enter, Return or Display Blanks Instead of Zeros in Excel by Avantix Learning Team | Updated January 4, 2024 Applies to: Microsoft® Excel® 2016, 2019, 2021 and 365 (Windows) There are several strategies to replace zero values (0) with blanks in Excel. If you want to...

What is Power Query in Excel?
What is Power Query in Excel and Why is It So Useful? by Avantix Learning Team | Updated November 18, 2023 Applies to: Microsoft® Excel® 2016, 2019, 2021 and 365 (Windows) Power Query in Excel is a powerful data transformation tool that allows you to import data from...
How to Freeze Rows in Excel (One or Multiple Rows)
Freeze One or More Rows in an Excel Worksheet by Avantix Learning Team | Updated October 25, 2023 Applies to: Microsoft® Excel® 2010, 2013, 2016, 2019, 2021 and 365 (Windows) You can freeze one or more rows in an Excel worksheet using the Freeze Panes command. If you...
Microsoft, the Microsoft logo, Microsoft Office and related Microsoft applications and logos are registered trademarks of Microsoft Corporation in Canada, US and other countries. All other trademarks are the property of the registered owners.
Avantix Learning |18 King Street East, Suite 1400, Toronto, Ontario, Canada M5C 1C4 | Contact us at info@avantixlearning.ca


